
Seven Useful Maps for Data Intensive Workflows
Mapping is regularly misconceived as overly complicated and deeply technical, and therefore belonging to the domain of experts. This could not be further from the truth as the following maps will show – everyone can benefit from using maps in their work and organisation.
Making your data spatial
The process of connecting data to a geographic point on Earth’s surface is called geocoding. This process, for example, translates a business address into geographic coordinates on a map, where a delivery driver could be routed to and a package could be delivered using navigational maps.
Geocoding is the first step to making your data spatial.
Geocoding engines can translate many types of data according to various levels of detail: a postal code or telephone code could place your data in a specific area or region, while a precise address could point you to a front door of the property.
Non-spatial data such as client names, financial records or say soil types can be tied or integrated into spatial data, either by directly linking it to geospatial records/data, or by using complementary spatial data to fill in data gaps or enhance your existing data.
Once your data is spatial or connected to spatial data, the following maps should help you organise, use, visualise, or analyse your data.
Easy to create and powerful to use maps
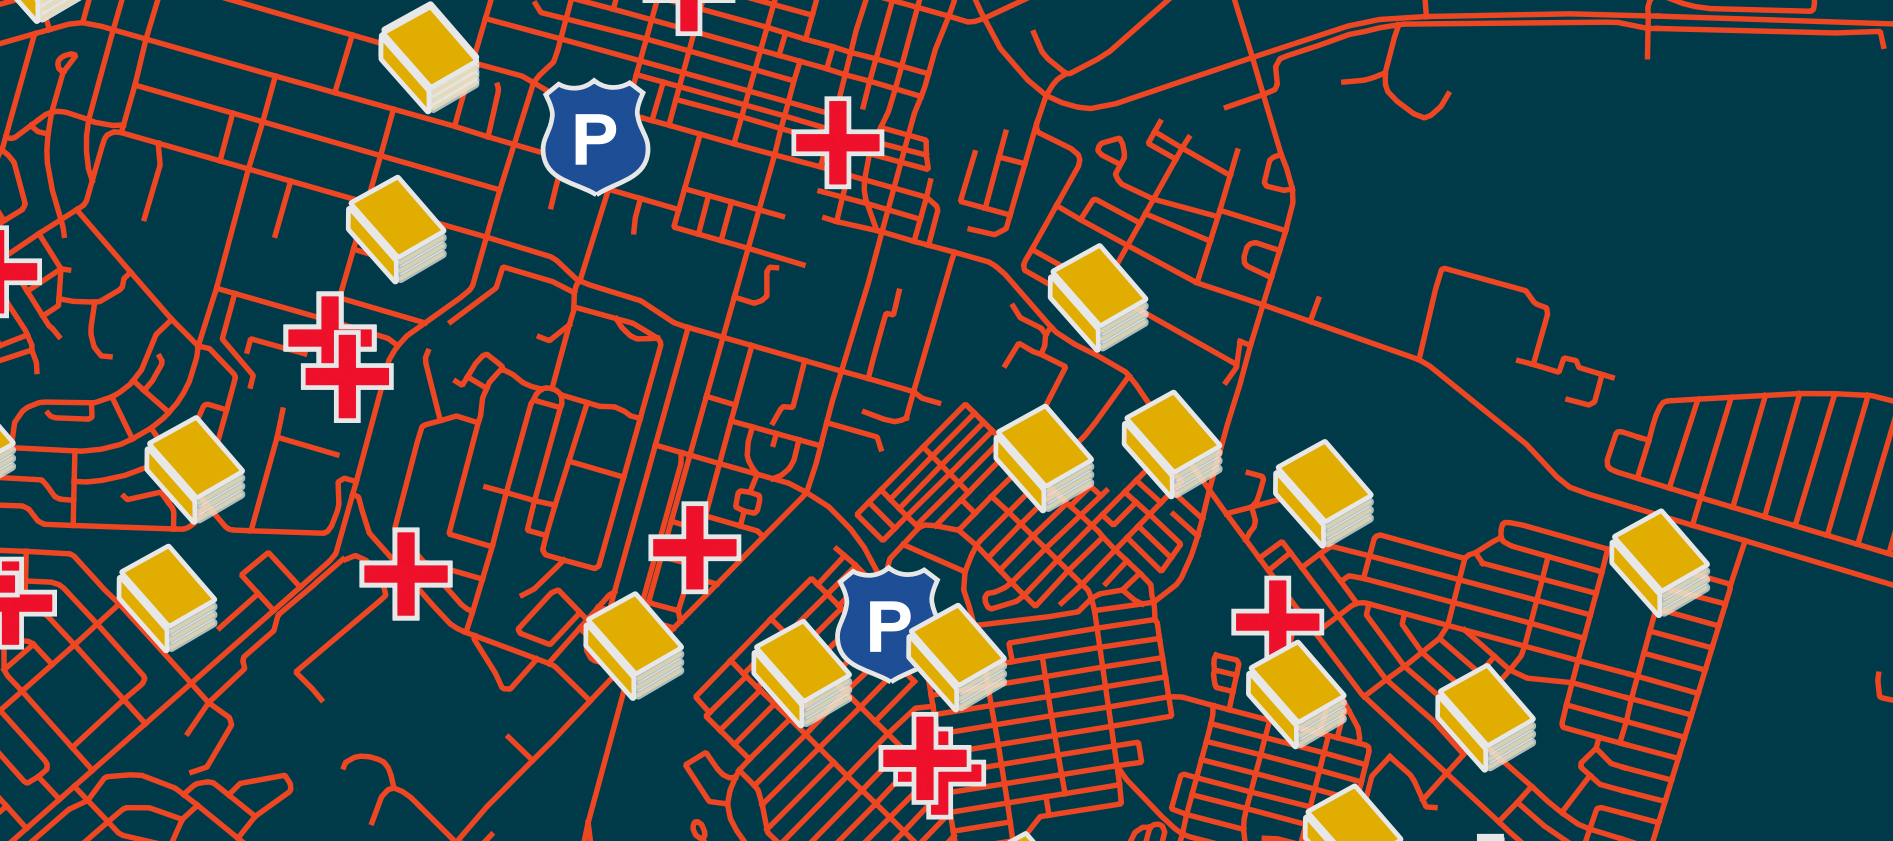
General reference maps might be most familiar to you if you’ve used a GPS or mapping app for navigation on your phone or in your travels. They show the general lay of the land, including landmarks such as tourist attractions, shops, hospitals, roads and more. These maps provide an overview of an area, and can provide context for other data.
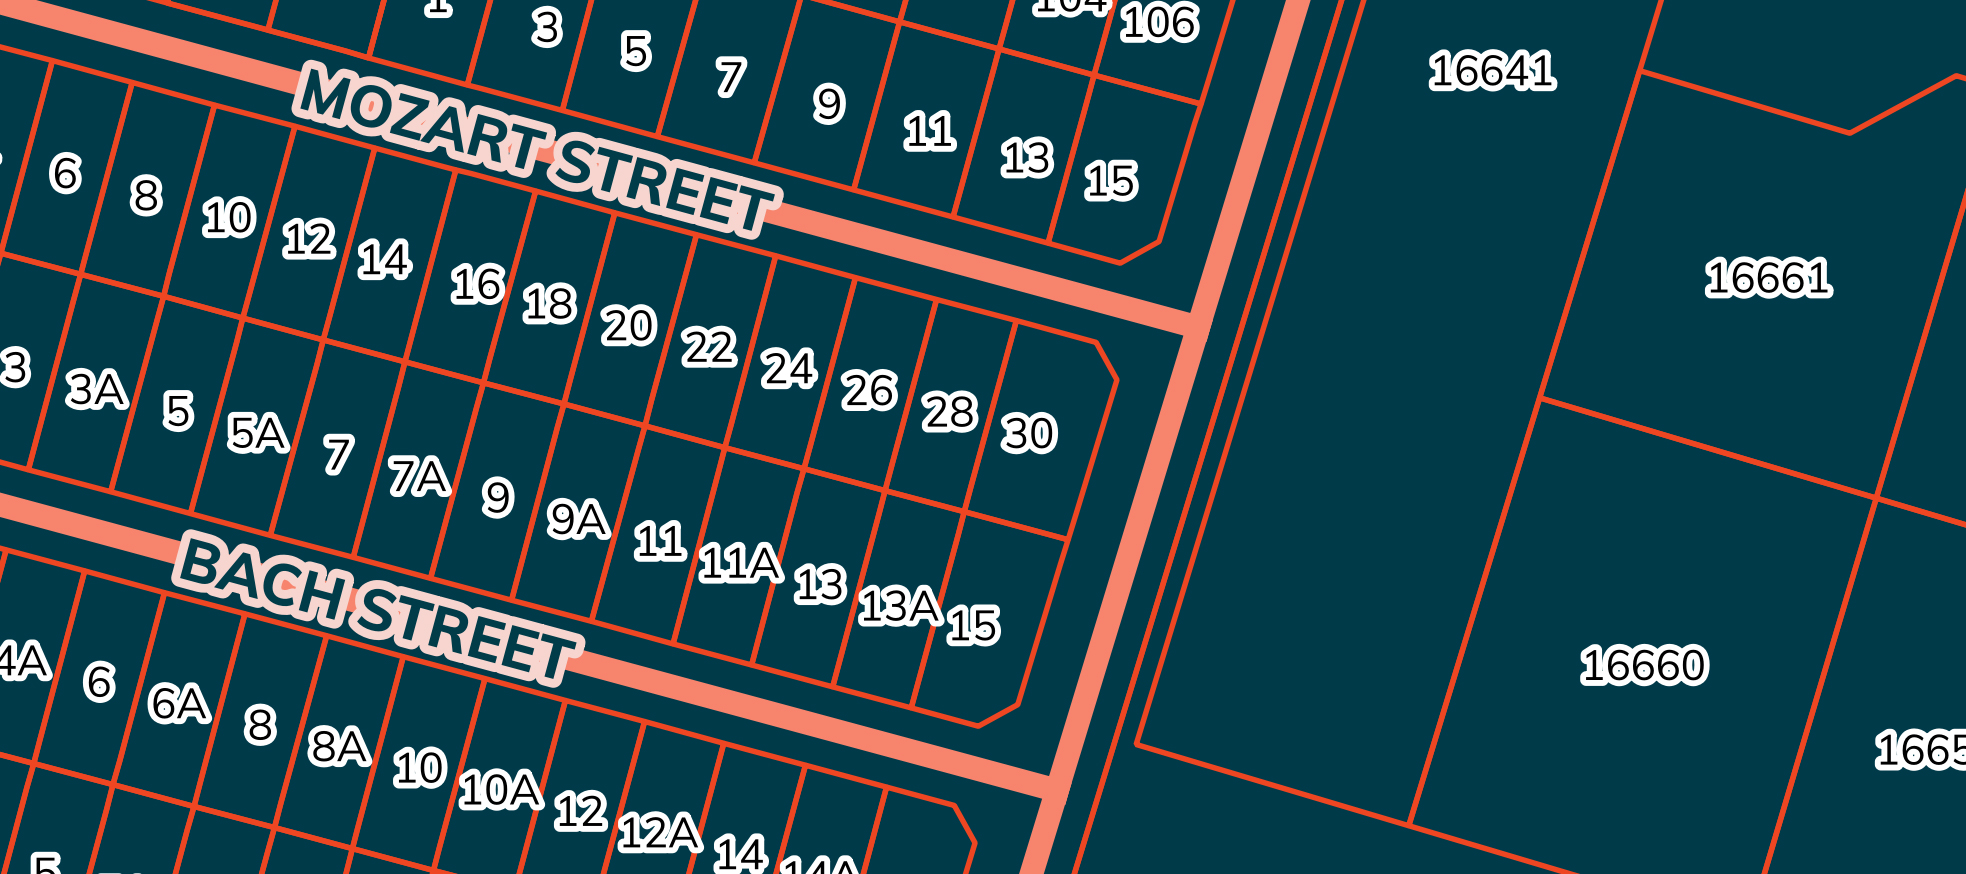
Cadastral maps are foundational spatial data, since they map legal entities – land parcels and their related ownership records (deeds). This makes cadastral maps very useful as basemaps on which to place other geospatial and related data.
(1map is a premier distributor of South African cadastral maps, and applies their own quality checks and processing to ensure consistent data for users of their cloud-based mapping platform.)
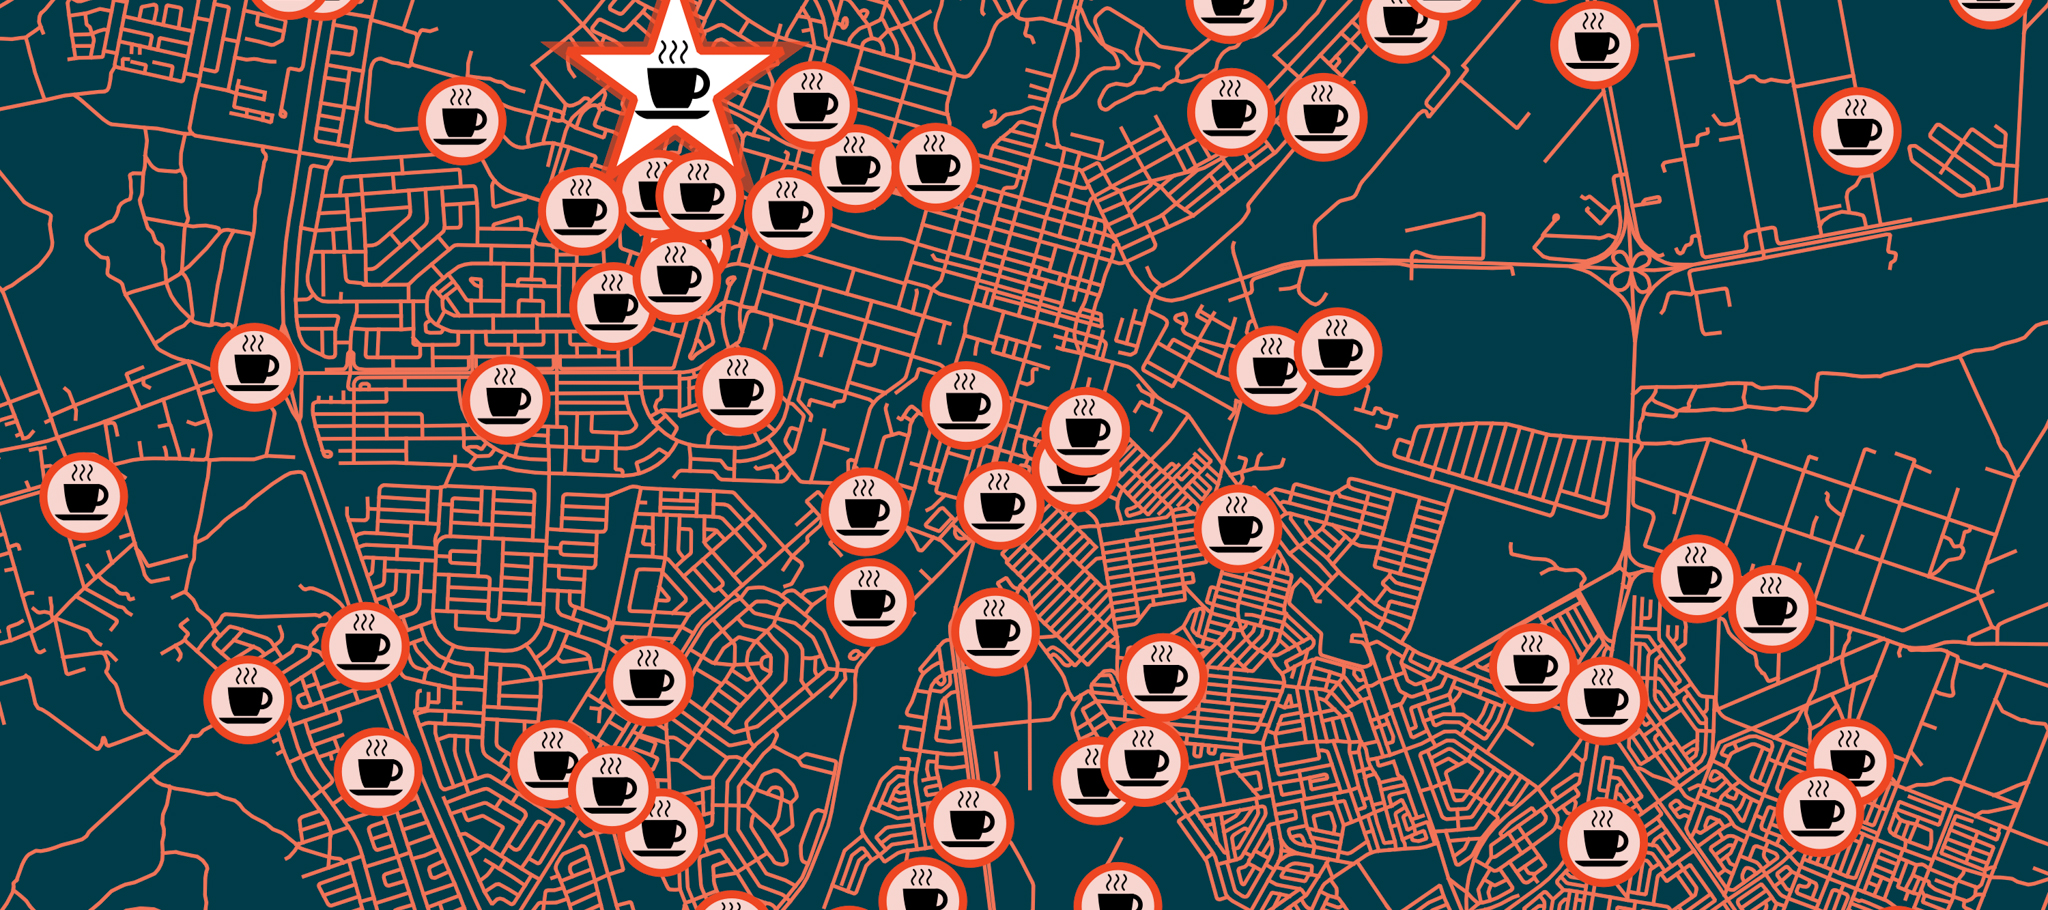
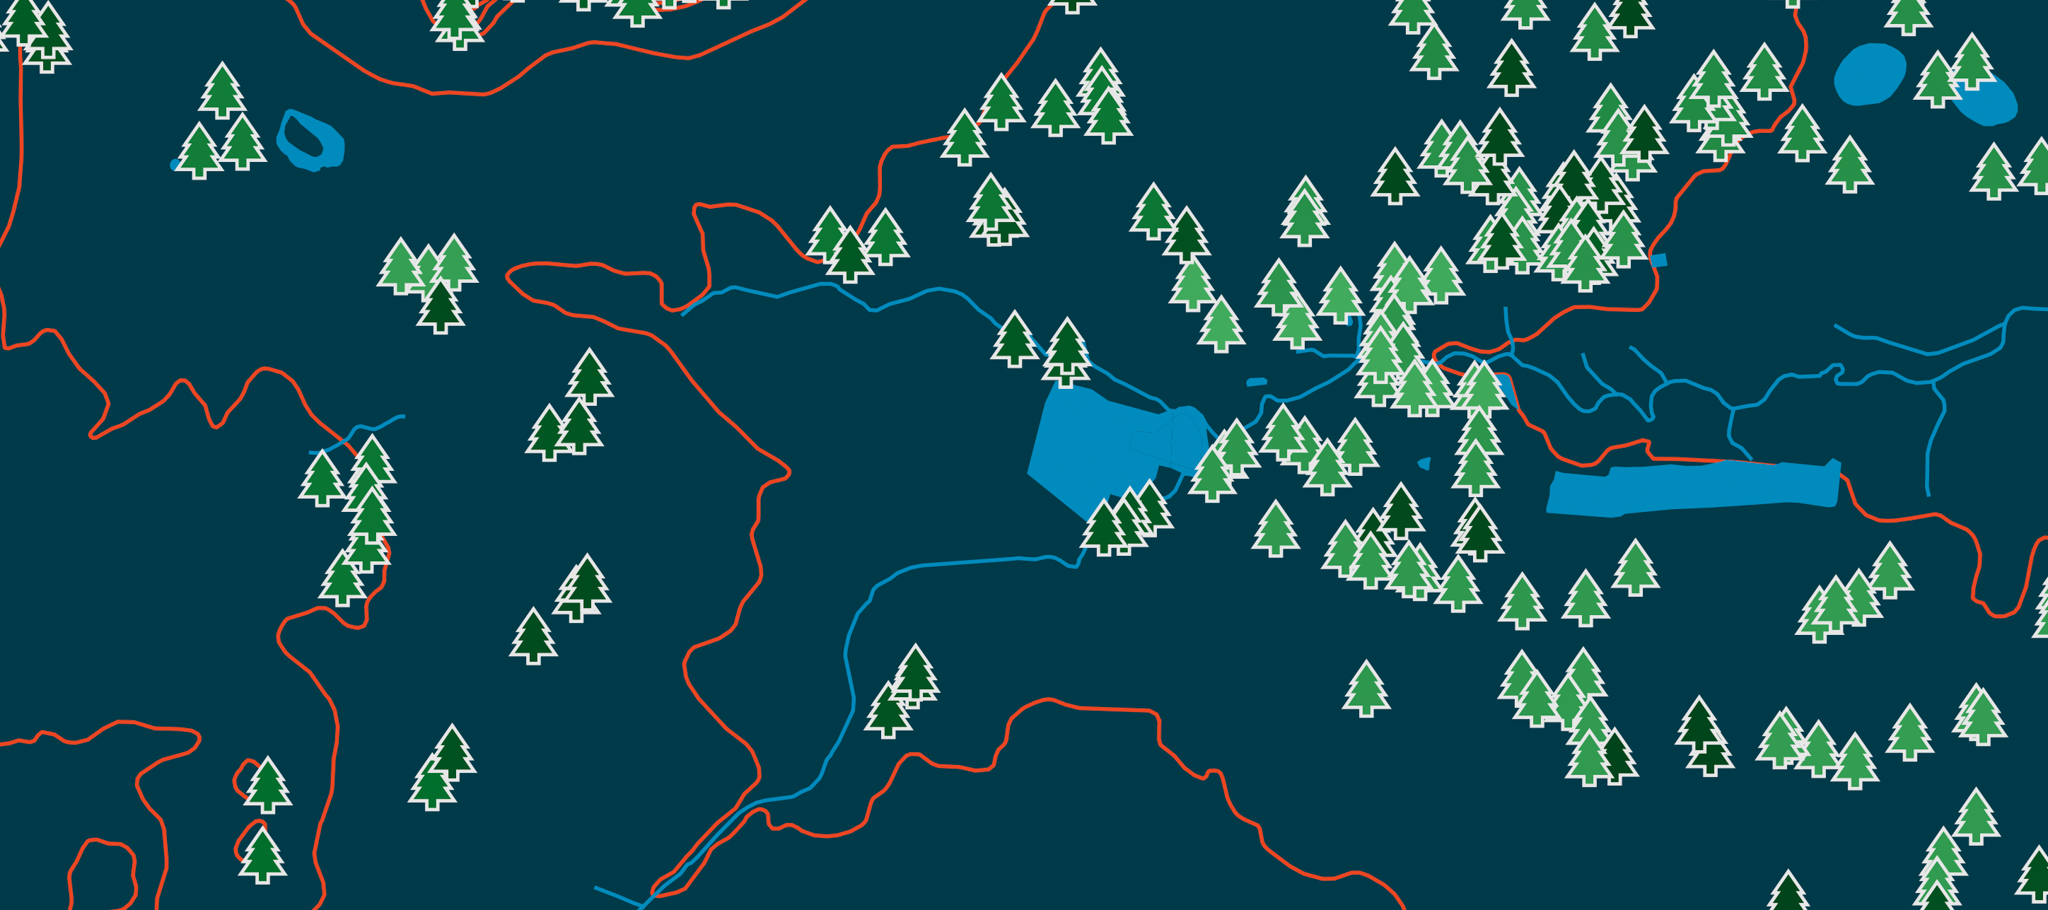
Point of Interest (PoI) maps show specific locations of interest, from coffee shops and fuel stations to hospitals and museums, and much more. PoI data can include your own store locations, or that of your competitor, and is useful for determining optimal distribution and client access. PoI maps are also useful complementary datasets, which could enhance your existing data, or provide proxy measures about the development or economic status of an area.
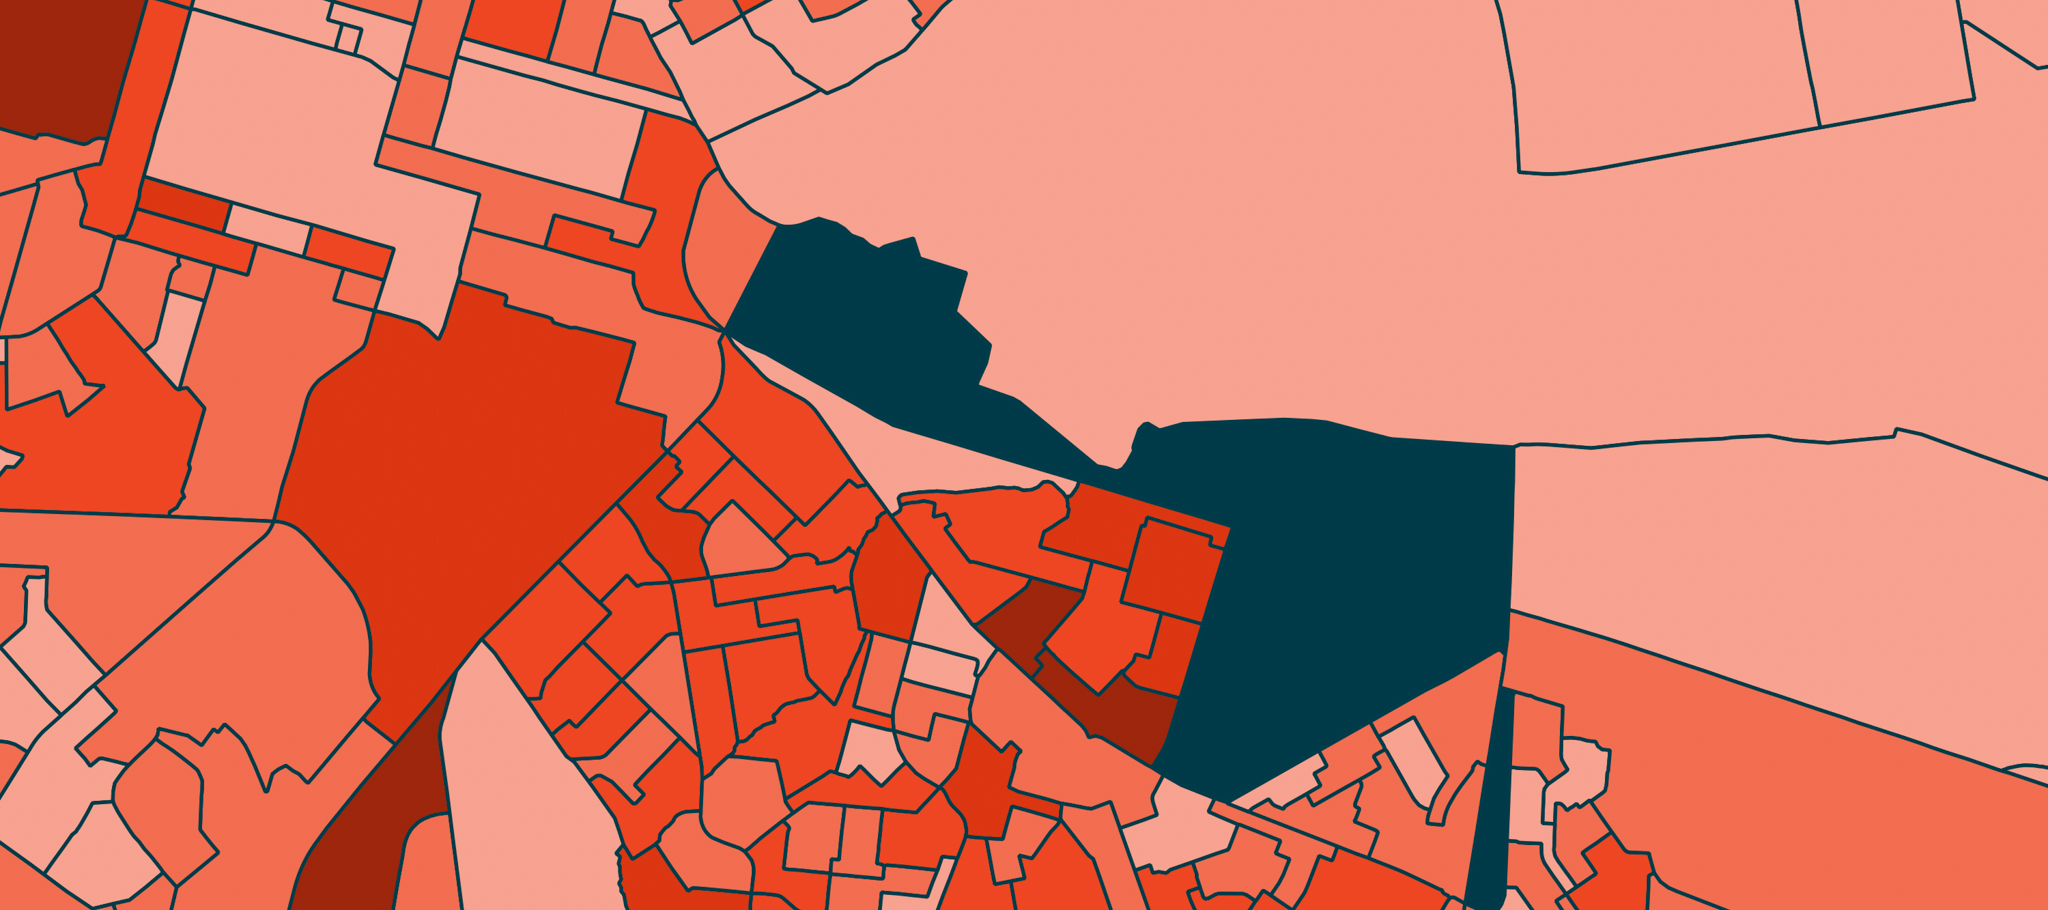
Thematic maps highlight data themes, and are useful for comparing or understanding variations in various types of datasets. This could include demographic data such as variations in age groups, income, access to a specific service in a region and more. Thematic maps are useful data visualisation and analysis tools, providing a quick overview of a dataset and enabling visual insights.
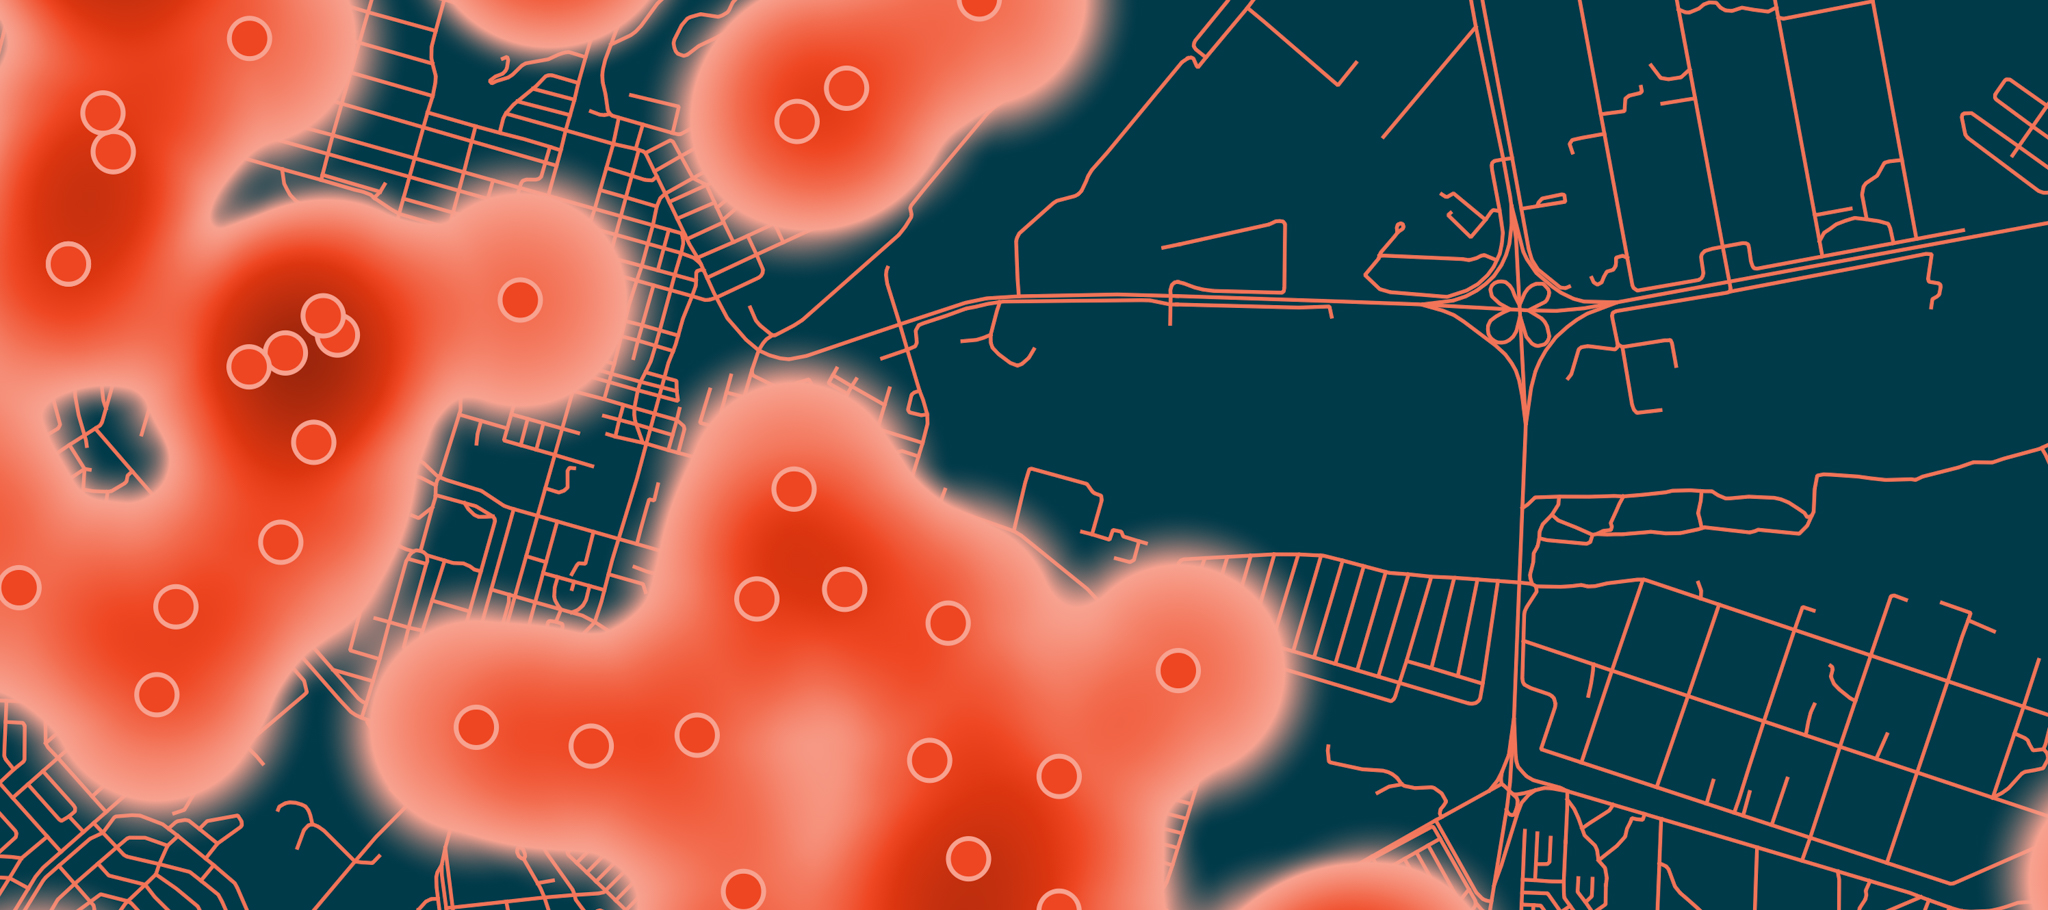
Heat maps show concentrations of data points, whether by numeric value or type. As such, they make for useful data analyses such as identifying areas of surplus or shortages, or general concentration measures like population density. These maps guide focus to key areas, or conversely show areas that require attention.
Topographic maps, or elevation maps, indicate terrain and landscape variations with contour lines. The closer contour lines appear to one another, the steeper the terrain. They also show natural features such as streams, rivers, mountains and more. These maps are useful for urban planning, in applications such as determining rainwater runoff or flooding, or views and possible obstructions from a certain viewpoint.
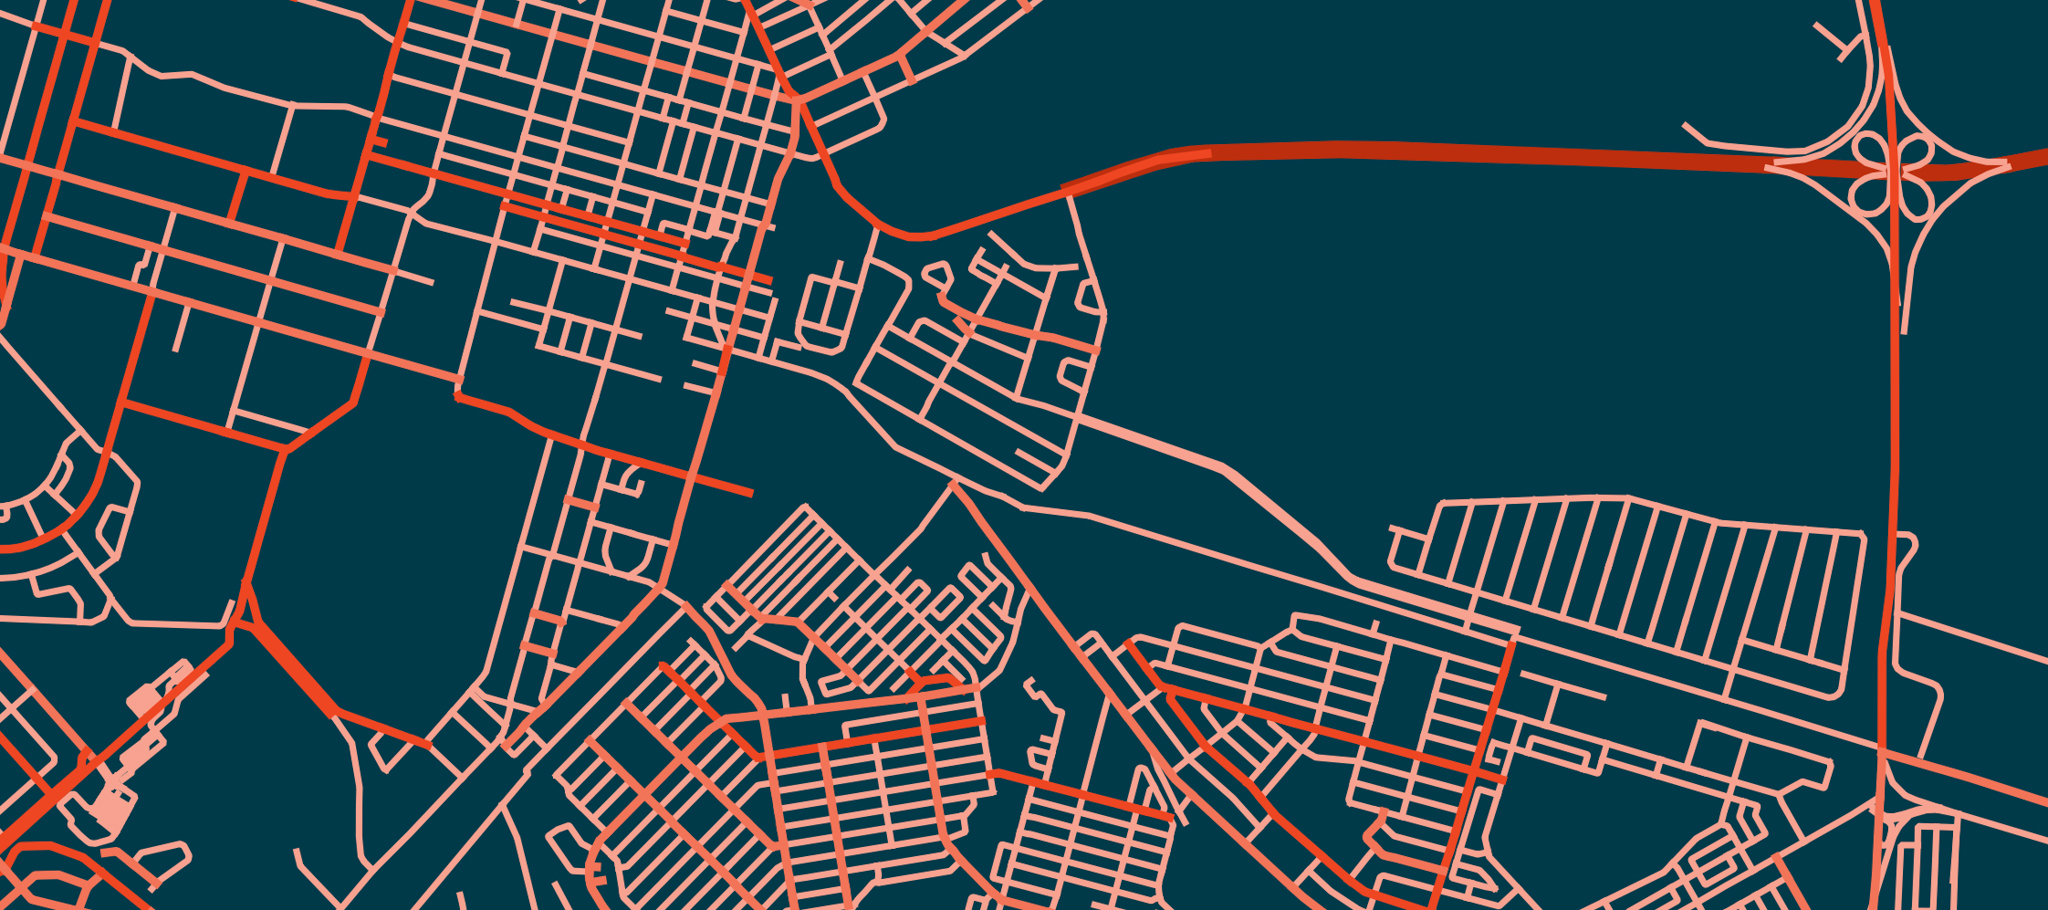
Road or navigational maps help you find routes and navigate between points. They usually also offer alternative routes, with high quality routing services being able to optimise routes based on shortest distance or quickest time. The best routing engines complement navigation data with point of interest data, traffic flow information, accident reports, and offer the ability to find the best route based on various stops – even updating routes as delivery plans change. Road maps can also be used for determining access to services – be it to a city, to your store, or to a town.
A plethora of enabling tools
Open data and public data, along with open-source mapping software such as QGIS have made spatial data and spatial data analyses accessible to anyone with a computer. The latest trend in mapping solutions is using cloud platforms such as 1map (coincidentally built on open-source technology).
Cloud platforms remove the need to install, manage servers, users and user access, and also enhances data sharing.
With intuitive user interfaces, these platforms don’t even require learning software, and often use common software features to help you complete your tasks to expectation. As platforms they can also be used to store, enrich, analyse and visualise data.
With new tools to unlock new insights in easier ways than ever before, there’s no reason not to incorporate mapping as a useful tool in most information workflows. These tools can aid and speed up the process of making sense and analysing data, help you quickly derive insights, and deal with large data volumes at once.
Talk to us about your unique challenges to find out if we have the solution you need.